

Two Graphs Named after Super-Fattening Foods
Dec 21, 2015
What do pies and doughnuts have in common? Well, we find them delicious, but they are fattening, take up a lot of space on your plate and in your stomach, have almost no nutritional value, and their principal behavioral impact is that they leave you craving even more non-nutritious food. And there’s high correlation between excessive consumption of these tasty treats and a wide variety of unpleasant health consequences.
So I find it ironic that two of the most popular forms of data visualization are the pie chart and its developmentally challenged sibling, the doughnut chart. To illustrate my point, consider this graph of the distribution of scoring on the NBA’s current top team, the Golden State Warriors. Click here or here to see this graph in its natural habitat; it also appeared in USA Today, always a great source of bad quantation:
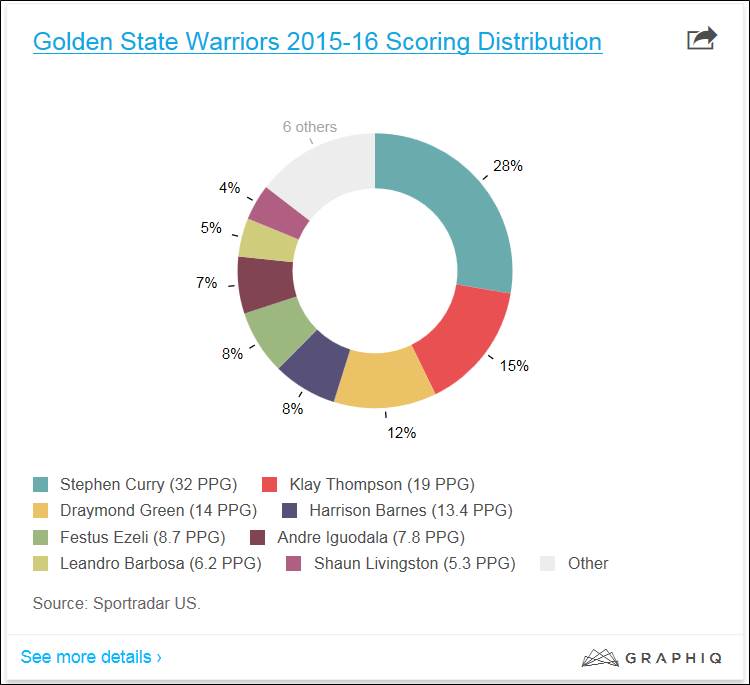
What’s wrong with this presentation? Let me count the ways:
- It takes up a lot of space. It’s nearly a full page, yet provides only nine data points.
- It’s hard to read. Your eye must jump back and forth between the colors of the doughnut slices (or pie wedges) and the color squares in the legend. This is hard, time-consuming work.
- It’s hard to make comparisons. Each doughnut slice is in its own plane, at a different angle from every other slice; this makes all but the grossest comparisons difficult.
- There is no context. More on this below.
So let’s try this graph again, this time using a 100% Stacked Column graph:
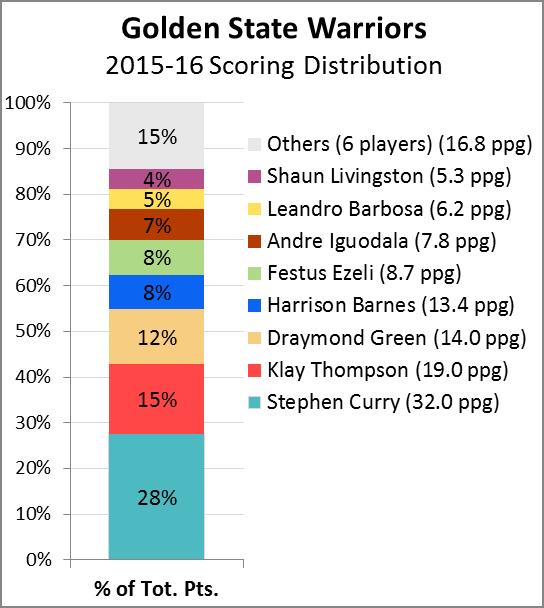
In about one-third the space, we now have a graph that’s much easier to read. The legend presents names and points-per-game in the same order as the corresponding elements in the stack. The relative size of each graph element is easier to compare to the others, because the differences all lie along the same dimension – vertical height. And there’s now additional information that was hard to extract from that high-carb doughnut chart; for example, it’s now easy to see from the vertical axis scale that top two players – Stephen Curry and Klay Thompson – accounted for more than 40% of the Warriors’ points, and the top three scored more than 50% of the total points.
Moreover, the problem of context is one of the most damning criticisms of pie/doughnut charts. Numbers mean nothing unless they can be compared to other numbers. How does the Warriors’ scoring distribution compare to other NBA teams? To last year’s team? So let’s pretend that the Warriors’ scoring distribution over the next 15 games was different from what we saw in the first 26 games. In only a bit more space, our 100% Stacked Column graph makes that comparison:
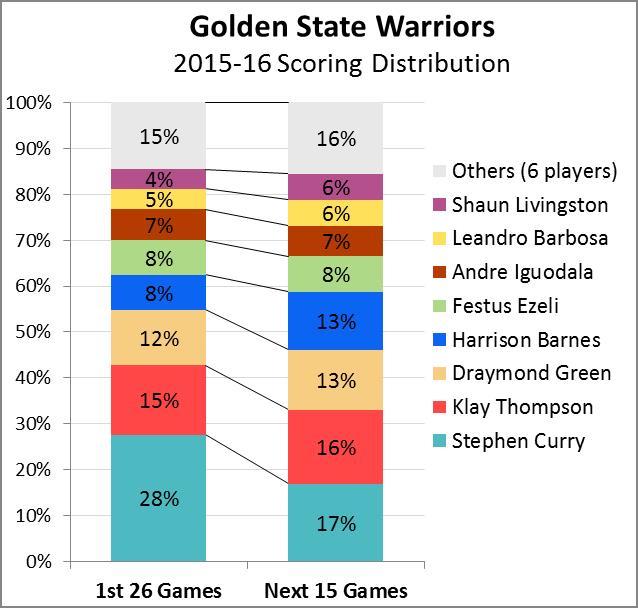
The only way to do this with doughnut charts would be to show two doughnuts side-by-side, which would (a) use up double the space and (b) be extremely difficult for visual comparisons. (I might add that in stacked column graphs, the series lines can be useful; here, you can easily tell whether a player’s share of the points is increasing or decreasing by whether the series lines converge (e.g., Stephen Curry) or diverge (e.g., Harrison Barnes).
We’re not quite finished yet, though. It’s easy to see that the scoring distribution across the team is evener over the next 15 games than it was in the first 26. But is that a good thing? So here’s another Stacked Column graph, this time using total points scored rather than normalizing to 100% of the total:
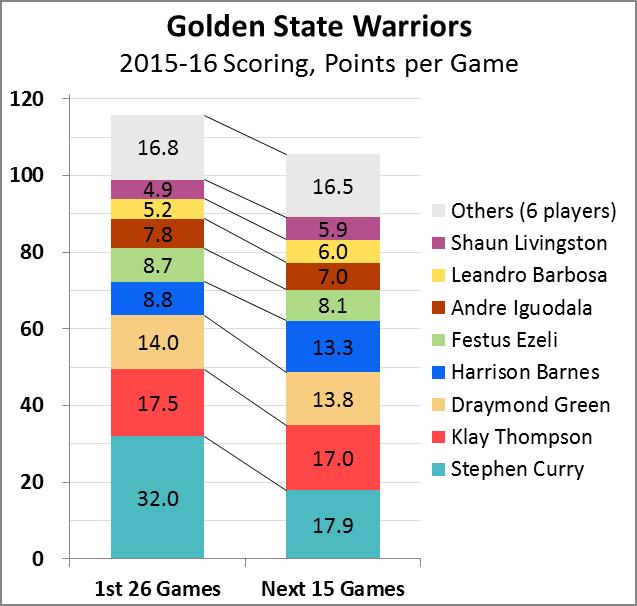
The Warriors clearly have a problem here: Stephen Curry’s average dropped by more than 14 points/game, and while the rest of the team picked up a little bit of the slack, the Warriors’ total scoring dropped from about 115 points/game to about 105. This conclusion could not have been reached with doughnut charts – not only are side-by-side charts difficult to compare for the reasons cited above, it’s even harder to make sense of the comparison when the two doughnuts are of different sizes.
This example from basketball illustrates a few of the many ways pies and doughnuts are deficient, in quantation as well as dietetically. So the next time you’re trying to decide how to present the principal components of your company’s operating expenses, or how your industry’s market share has evolved over the years, remember that just because a graph looks tasty doesn’t mean it will provide adequate nutrition for your audience.
“Painting with Numbers” is my effort to get people to focus on making numbers understandable. I welcome your feedback and your favorite examples. Follow me on twitter at @RandallBolten.Other Topics