

Are You an Ethical Presenter? Oh, Really? (#3)
Mar 24, 2014
Again, we look at how the way numbers are presented can affect how the presenter’s integrity and ethics are perceived. But this time, we look at what’s omitted. Our subject is again Constant Contact’s (Nasdaq: CTCT) investor presentation (click here for the original document).
In several places in the presentation, CTCT alludes to its past and potential profitability. Here’s an example:
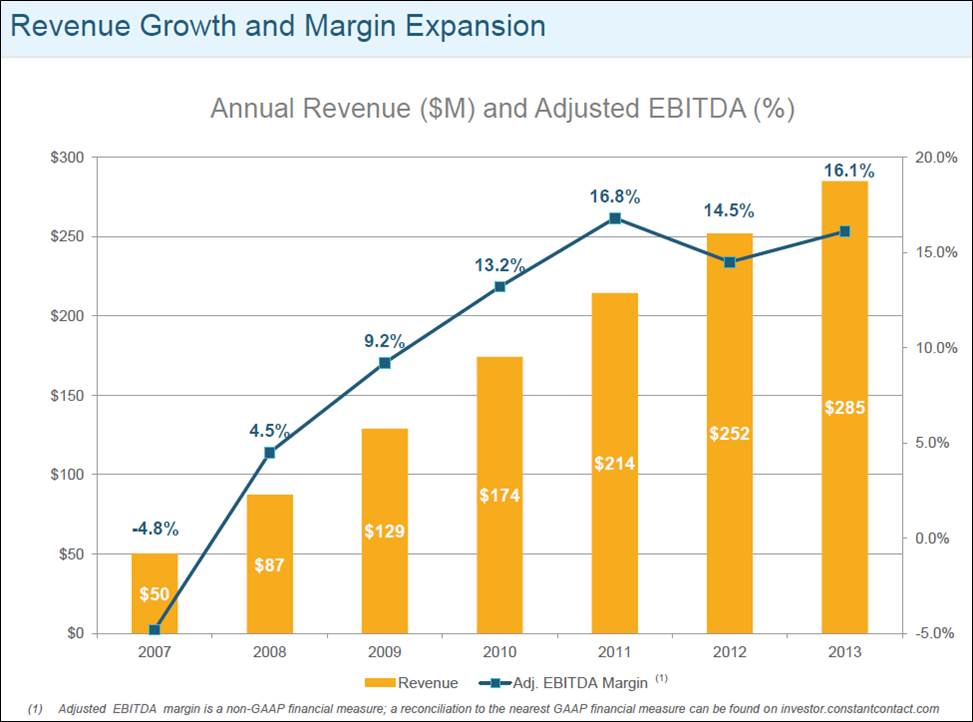
CTCT presents “Adjusted EBITDA” and “Free Cash Flow” in several places in the presentation, but nowhere do they present Operating Income, Net Income, EPS or any other GAAP-standard profitability metrics. They do include the following footnote:
“Adjusted EBITDA margin is a non-GAAP financial measure; a reconciliation to the nearest GAAP financial measure can be found on investor.constantcontact.com.”
Put another way, “If you want to see the corresponding GAAP numbers, you’ll have to work for it.”
Both EBITDA and Free Cash Flow are metrics that look “better” than their closest GAAP equivalents because they are calculated by adding back certain expenses and expenditures. For that reason, even if CTCT asserts that these are the most appropriate and valid metrics – a highly arguable assertion, but let’s leave that aside for now – presenting those metrics to the complete exclusion of their GAAP equivalents is certain to raise questions in the minds of some in the audience – questions like, “Why don’t they want us to look at the GAAP numbers?” “Are they hiding something?”
Again I ask: Is the potential benefit of spinning your information worth the potential impact on how you are perceived as a presenter? Only this time, the spinning doesn’t lie in what you do present, but in what you don’t present.
As we leave this subject, let’s last consider the frequency of these perhaps unfortunate presentation choices. One such choice is probably innocent or at least not worth focusing on, but three (click here and here for my other posts about CTCT’s presentation) is more likely to make us question the presenter’s intentions.
[We’ll also leave aside for now the facts that “Adjusted” EBITDA (%) isn’t defined and that they don’t state what it’s a percentage of, as well as the question of whether showing these two metrics on the same graph, with two vertical axes, is a valid and appropriate way to present this information. Perhaps some other time. . .]
“Painting with Numbers” is my effort to get people to focus on making numbers understandable. I welcome your feedback and your favorite examples. Follow me on twitter at @RandallBolten.
In several places in the presentation, CTCT alludes to its past and potential profitability. Here’s an example:
CTCT presents “Adjusted EBITDA” and “Free Cash Flow” in several places in the presentation, but nowhere do they present Operating Income, Net Income, EPS or any other GAAP-standard profitability metrics. They do include the following footnote:
“Adjusted EBITDA margin is a non-GAAP financial measure; a reconciliation to the nearest GAAP financial measure can be found on investor.constantcontact.com.”
Put another way, “If you want to see the corresponding GAAP numbers, you’ll have to work for it.”
Both EBITDA and Free Cash Flow are metrics that look “better” than their closest GAAP equivalents because they are calculated by adding back certain expenses and expenditures. For that reason, even if CTCT asserts that these are the most appropriate and valid metrics – a highly arguable assertion, but let’s leave that aside for now – presenting those metrics to the complete exclusion of their GAAP equivalents is certain to raise questions in the minds of some in the audience – questions like, “Why don’t they want us to look at the GAAP numbers?” “Are they hiding something?”
Again I ask: Is the potential benefit of spinning your information worth the potential impact on how you are perceived as a presenter? Only this time, the spinning doesn’t lie in what you do present, but in what you don’t present.
As we leave this subject, let’s last consider the frequency of these perhaps unfortunate presentation choices. One such choice is probably innocent or at least not worth focusing on, but three (click here and here for my other posts about CTCT’s presentation) is more likely to make us question the presenter’s intentions.
[We’ll also leave aside for now the facts that “Adjusted” EBITDA (%) isn’t defined and that they don’t state what it’s a percentage of, as well as the question of whether showing these two metrics on the same graph, with two vertical axes, is a valid and appropriate way to present this information. Perhaps some other time. . .]
“Painting with Numbers” is my effort to get people to focus on making numbers understandable. I welcome your feedback and your favorite examples. Follow me on twitter at @RandallBolten.
Related Blogs
Other Topics
Other Topics