

Comparing Clayton Kershaw with Jackson Pollock & Joan Miró
Jun 6, 2016
Michael Clair’s fascinating article on L.A. Dodgers pitching ace Clayton Kershaw’s pursuit of an obscure but astonishing baseball record, illustrates just how powerful ratios – or key indicators, KIs, KPIs, or whatever else you want to call these metrics – can be in sports, business, personal finance, and many other walks of life. It also shows how such metrics should NOT be used.
Kershaw is chasing the single-season strikeouts:walks ratio (K:W) record. After about one-third of a season, Kershaw had struck out 105 batters and walked only 5, for a 21:1 K:W. What’s remarkable is that most high-strikeout pitchers rely on speed and power, rather than the pinpoint control needed to keep walks to a minimum. Kershaw has both gifts.
Clair identifies five ways to put Kershaw’s accomplishment into context. First, he compares it to previous K:W bests. In 115 years of modern major-league baseball history, only three starting pitchers have had a K:W higher than 10:1 for a full season, with an all-time record of 11.63:1 (Phil Hughes in 2014). (The modern-era career best is Curt Schilling’s 4.38:1 over 20 seasons, with the Giants’ Madison Bumgarner breathing down his neck with 4.18:1. So far.)
So Kershaw is on a pace to obliterate a record in much the same way Steph Curry of the Golden State Warriors laid waste this year to some NBA records for 3-point baskets (click here for my blog on that).
This is exactly what ratios should be used for.
And this is where Clair should have stopped. Unfortunately, he goes on to attempt to put a 21:1 K:W into even more context. First, he notes how often this year pitchers have had 5 walks in a single game – interesting, but not additionally meaningful, unless we’re comparing single-game performance to, say, performance over a whole season. He goes on to compare a 21:1 K:W to 21:1 ratios in other areas that are utterly unrelated except that they are baseball statistics – like comparing Barry Bonds’s 762 career home runs to Joe Girardi’s 36 – thereby proving that if you look hard enough, you can find 21:1 ratios all over the place.
This is exactly what ratios should NOT be used for. And if you’re using ratios and other metrics to persuade, this is not a harmless mistake – the data overload may cause your audience to miss your most important points.
Clair wraps it all up by showing us the mapping of Kershaw’s strikeouts and walks, shown below:
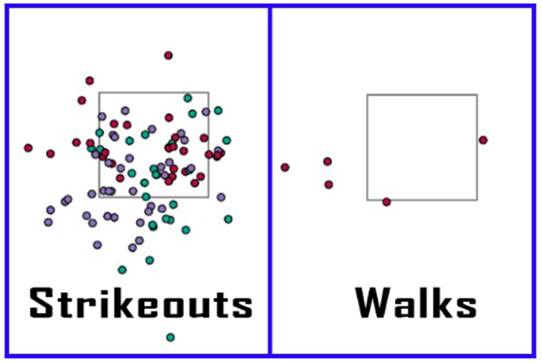
I couldn’t find these graphs on the Baseball Savant website, so I have absolutely no idea what they mean – I’m guessing they show his pitch locations relative to the strike zone. Other than that, all we learn is that Kershaw has many more strikeouts than walks – which we already knew. But Clair goes on to compare the above graphs to the work of 20th century painters Jackson Polloack and Joan Miró, respectively:

This information, “for the visual learner,” is equally irrelevant, but at least we’re treated to some interesting artwork! Now, if Clair could compare Kershaw’s art to Warhol and Picasso, or maybe da Vinci, he’ll really have something.
“Painting with Numbers” is my effort to get people to focus on making numbers understandable. I welcome your feedback and your favorite examples. Follow me on twitter at @RandallBolten.Other Topics