

U.S Manufacturing Jobs: Catching a Falling Knife?
Jan 18, 2017
I don’t usually make policy statements in this blog, but sometimes a simple and clear presentation of data says everything that needs to be said. The trend in U.S. manufacturing jobs over the last 70+ years is a great example.
In last week’s post, we looked at the share of the labor force representing people who “made things,” and how that share had declined since 1990. Here’s the graph we looked at:
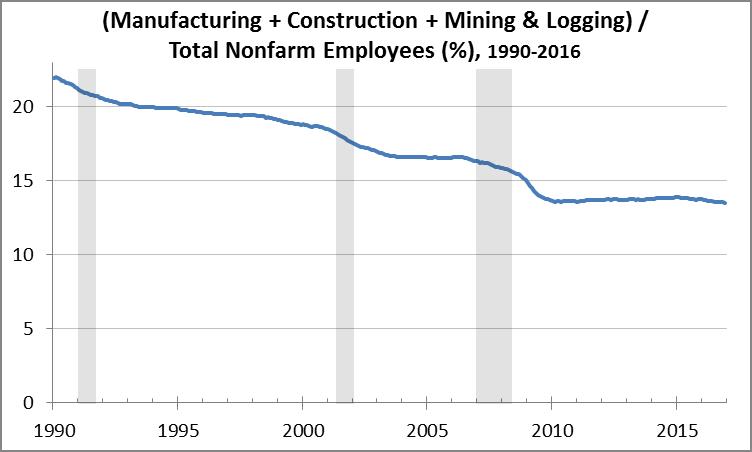
It shows an unmistakable downward trend. And the topic of manufacturing jobs has drawn a lot of attention during the past presidential campaign and the run-up to this week’s inauguration, since somebody's doing the manufacturing. So let’s take another look – one that’s different from the above graph in two ways: (1) Include only manufacturing jobs, since Construction and Mining & Logging aren’t jobs that can be easily moved offshore, and (2) go as far back as the data allows, which is 1939 in the Federal Reserve’s excellent FRED database. Here’s the new graph:
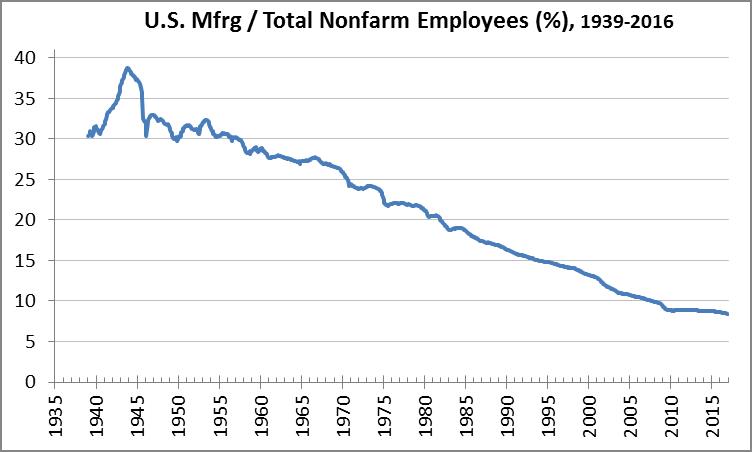
What we see is a steady, monotonous decline in manufacturing’s share of the U.S. labor force, from a peak of more than 38% at the height of WWII, to about 8.5% today. This is a 70-year trend that can’t be blamed on China, or Mexico, or a trade deal that didn’t go into effect until 1994. And even so, the U.S. has prospered significantly since the end of WWII.
We’re not here to examine the reasons for the decline – they’ve been analyzed elsewhere, exhaustively and by experts. But basing U.S. public policy on trying to stop an irreversible trend is expensive and fruitless. It makes a lot more sense to use public policy to focus our labor force on the many skills and tasks that Americans are better at than anyone else.
I’ll leave you with another numbers comparison: In the 1790 U.S. census, fully 90% (that’s NINETY PERCENT) of the American labor force was engaged in agriculture; today that percentage is about 3%. So why isn’t our unemployment rate at least 87%? And where would the U.S. economy be today if the federal government’s policy for the last 225 years had been to save agriculture jobs at the expense of taxpayers and of other sectors of the economy?
“Painting with Numbers” is my effort to get people to focus on making numbers understandable. I welcome your feedback and your favorite examples. Follow me on twitter at @RandallBolten.
Other Topics